Commercial Visibility for Evolving Design.
QRView transforms evolving design data into actionable commercial intelligence.
A secure cloud platform built for complex projects where design evolves continuously but commercial visibility remains limited.

HOW IT WORKS
QRView connects evolving project data to a controlled commercial baseline, allowing movement to be tracked, interpreted and reported throughout design progression.
The platform works alongside existing estimating, governance and reporting processes — not in place of them.
DESIGN DATA
Structured project inputs connected to a measurable baseline.


-
Quantities are extracted directly from IFC model data to create measurable design intelligence.
Information can be reviewed consistently regardless of the authoring platform used by the design team.
Design movement can be processed across multiple iterations, zones and disciplines.

-
Commercial inputs are connected directly to the platform baseline for measurable movement tracking.
Design progression can be assessed against the live commercial structure of the project.
Portfolio-level benchmarking enables more consistent comparison across projects.
-
Design progression can be reviewed continuously rather than through isolated reporting snapshots.
QRView tracks:
shifting quantities and elements,
affected packages, disciplines and zones,
emerging or stabilising areas of movement.
ANALYSE
INTERPRET
OUTPUT
COMMERCIAL VISIBILITY
Clear commercial insight for confident project decisions.

-
Design movement is mapped back to commercial structures to quantify indicative cost exposure.
The platform creates a measurable connection between design progression and commercial impact.

-
QRView helps distinguish between areas with strong visibility and areas requiring further validation or stakeholder review.
Focus areas include:
emerging risk items,
validation or confidence gaps,
interpretation blind spots.

-
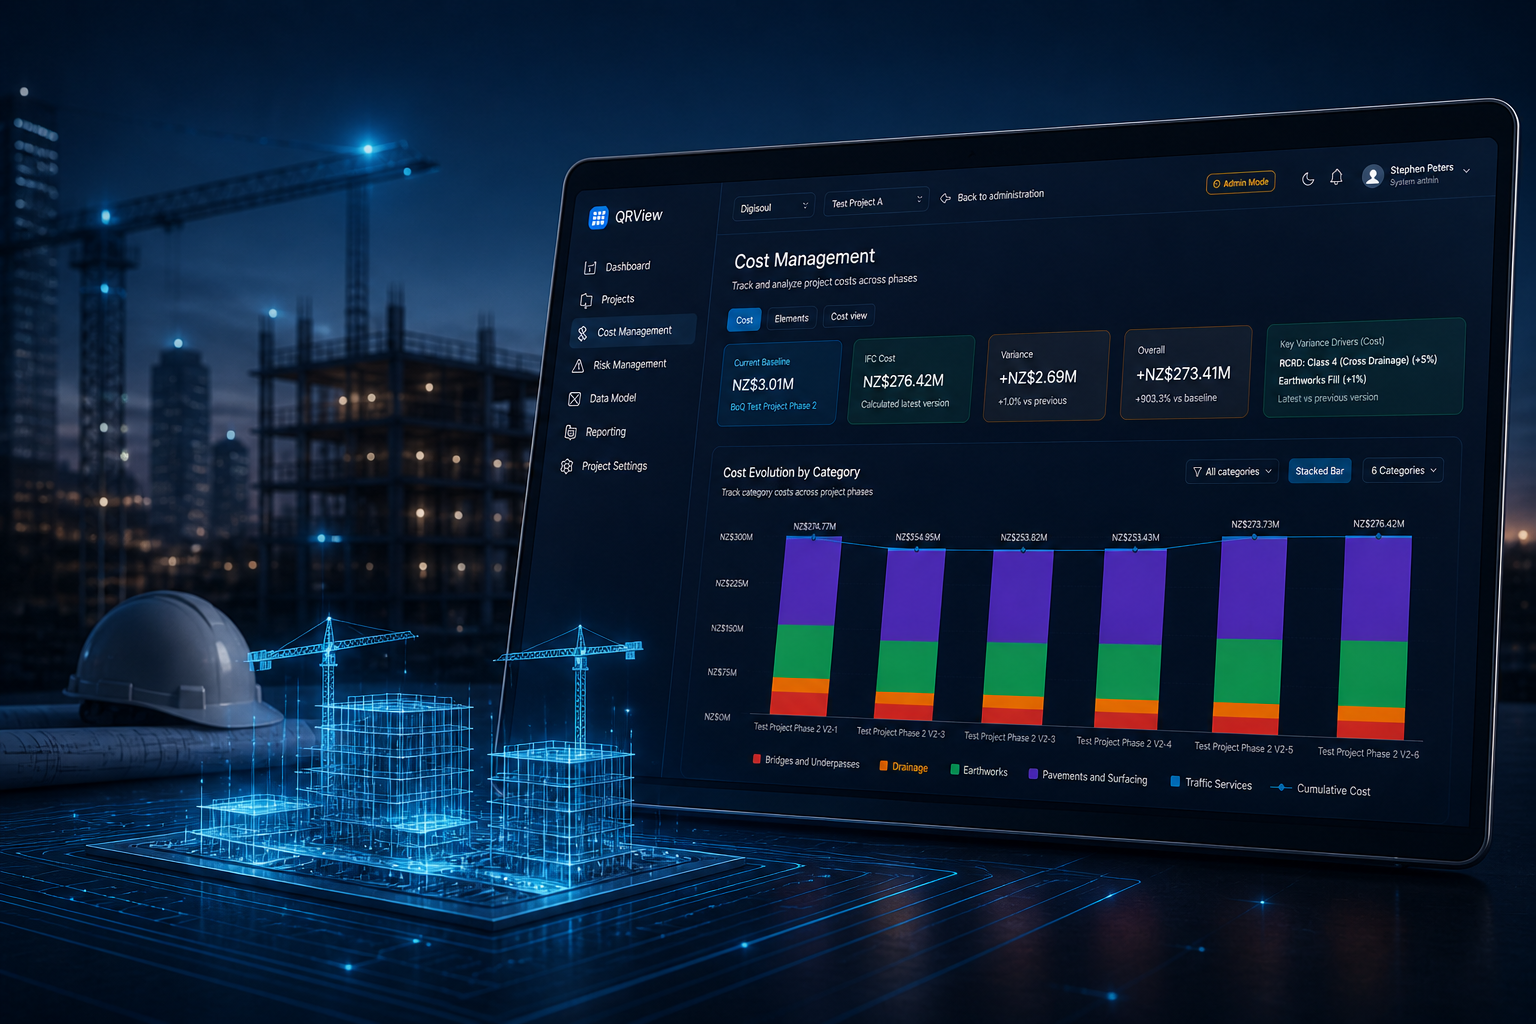
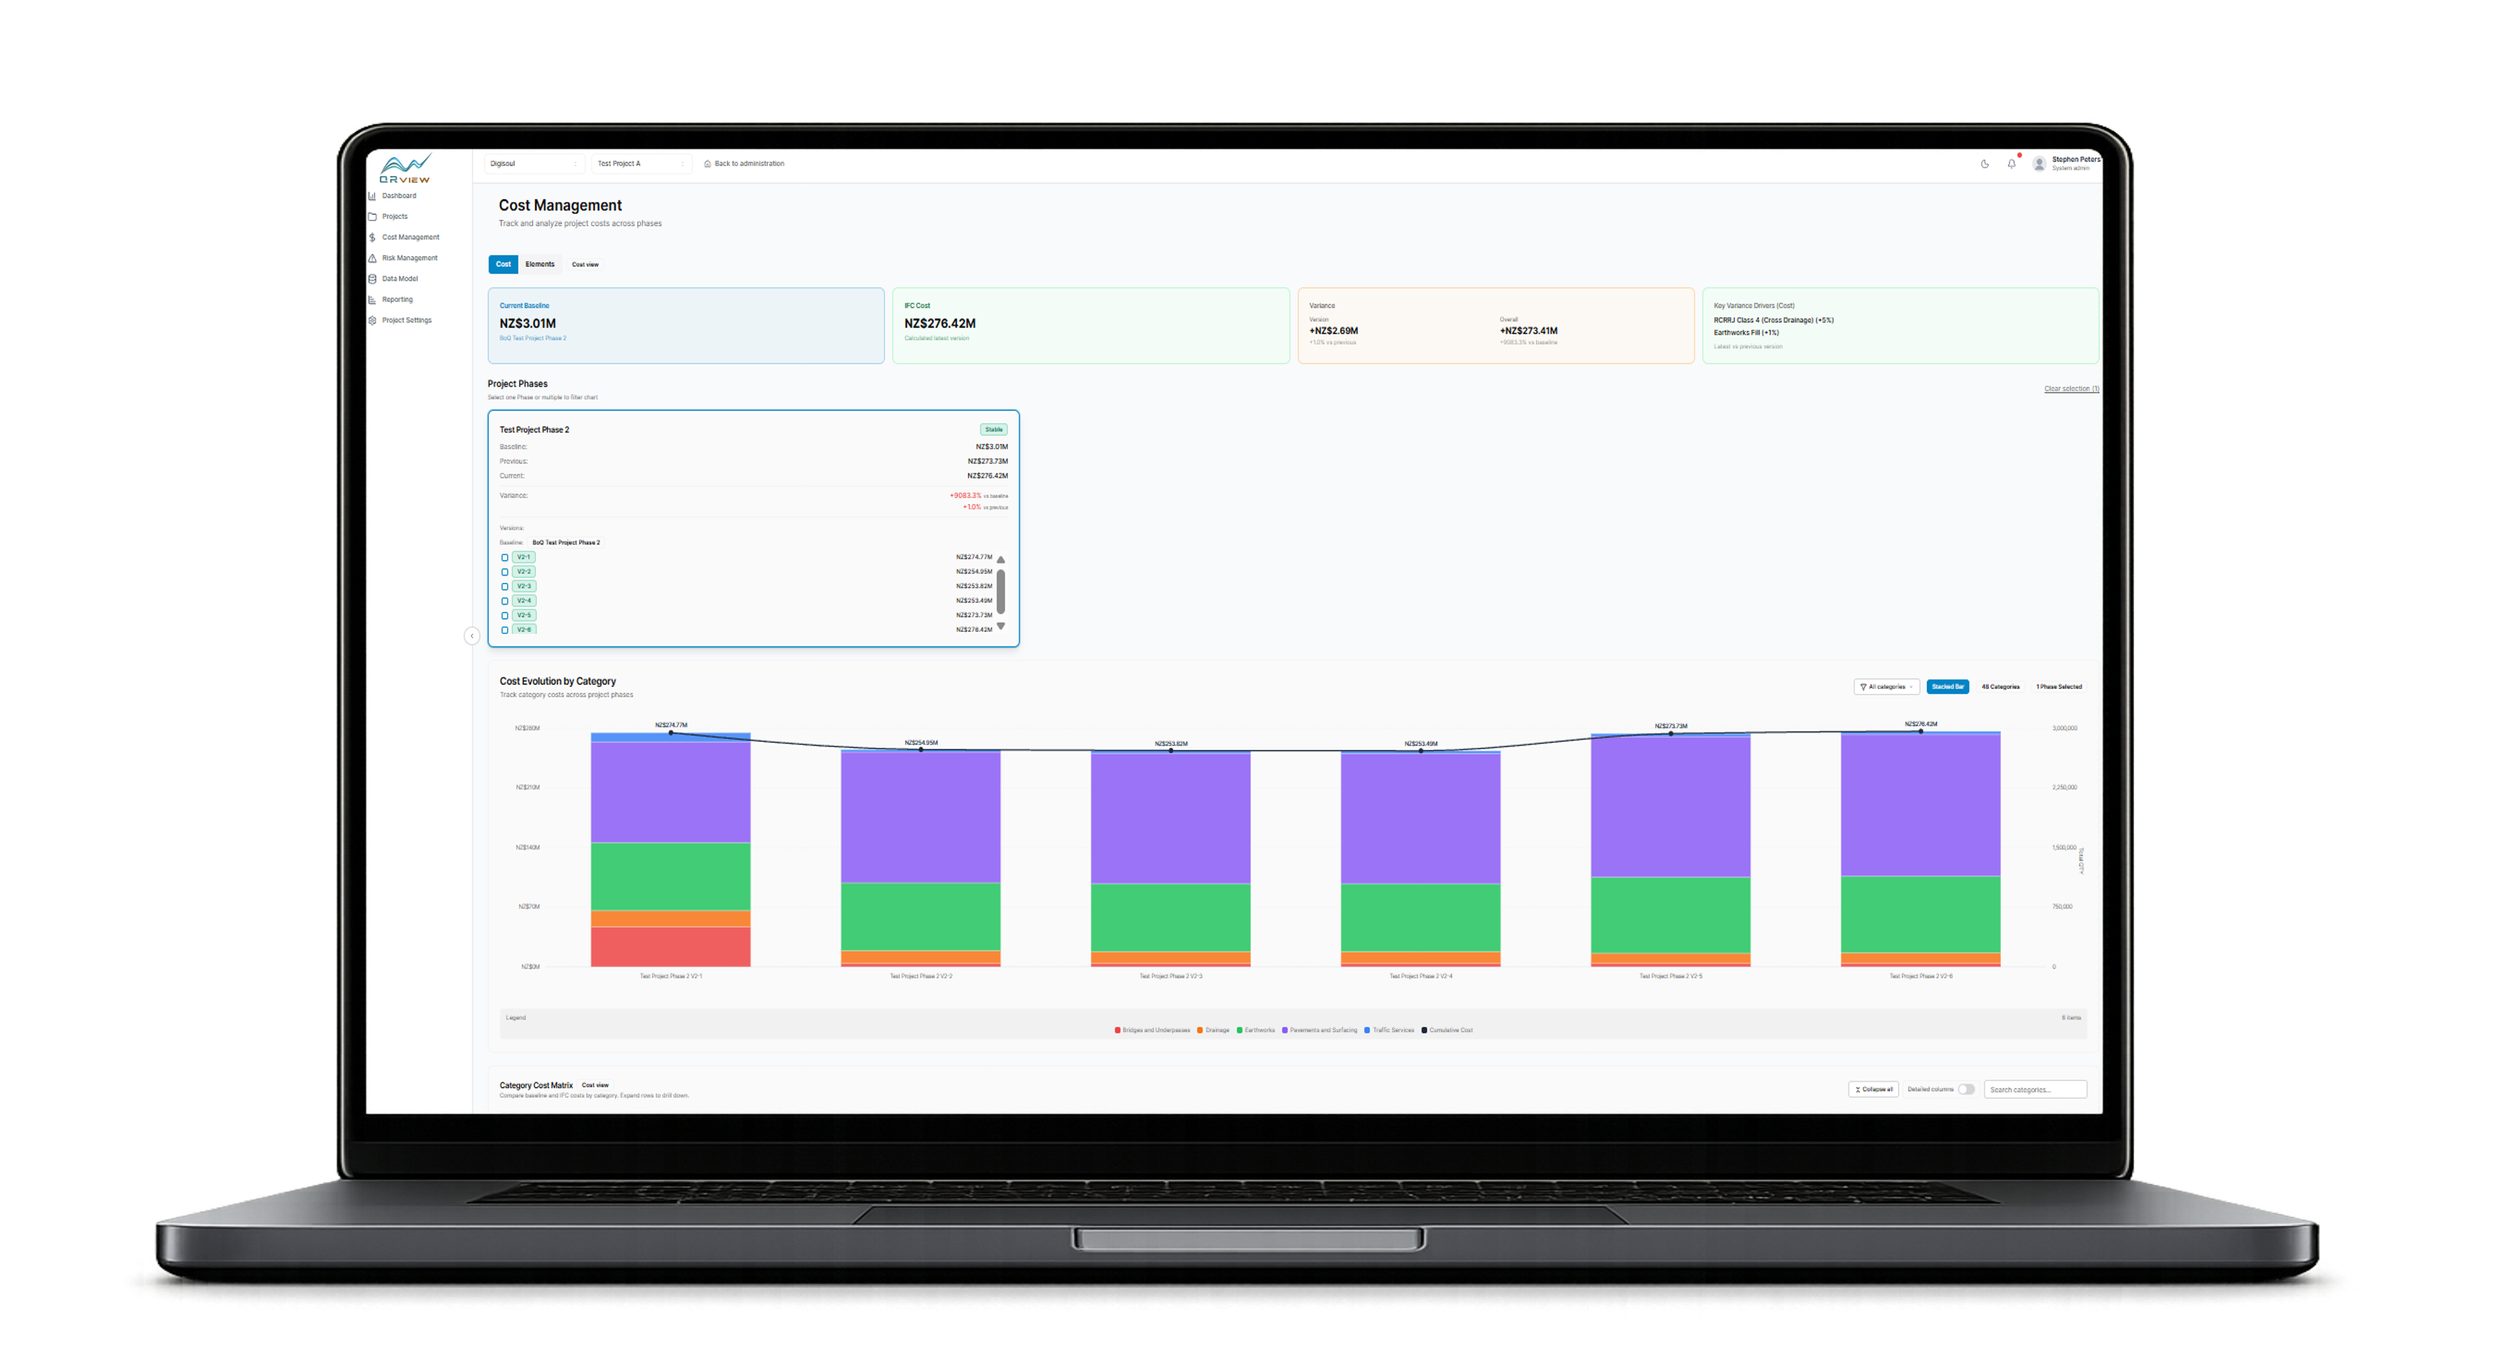
Interactive dashboards consolidate live project data into a single commercial view.
Registers create a structured record of movement, issues and review items.
Teams can monitor progression, exposure and emerging trends more consistently.

-
Tailored reporting outputs support technical reviews, commercial governance and executive decision-making.
Configurable reporting structures reduce reliance on manually rebuilt reporting packs.
Outputs can be aligned to different project teams, stakeholder groups and governance forums.
-
Cost structures, BoQ’s, estimates and assumptions establish a measurable commercial reference point.
The baseline allows future design movement to be isolated, compared and tracked over time.
Changes can be reviewed against the original commercial position as projects evolve.
HOW IT WORKS
QRView connects evolving project data to a controlled commercial baseline, allowing movement to be tracked, interpreted and reported throughout design progression.
The platform works alongside existing estimating, governance and reporting processes — not in place of them.
DESIGN DATA
Structured project inputs connected to a measurable baseline.
-
Cost structures, BoQ’s, estimates and assumptions establish a measurable commercial reference point.
The baseline allows future design movement to be isolated, compared and tracked over time.
Changes can be reviewed against the original commercial position as projects evolve.
-
Quantities are extracted directly from IFC model data to create measurable design intelligence.
Information can be reviewed consistently regardless of the authoring platform used by the design team.
Design movement can be processed across multiple iterations, zones and disciplines.
-
Commercial inputs are connected directly to the platform baseline for measurable movement tracking.
Design progression can be assessed against the live commercial structure of the project.
Portfolio-level benchmarking enables more consistent comparison across projects.
-
Design progression can be reviewed continuously rather than through isolated reporting snapshots.
QRView tracks:
shifting quantities and elements,
affected packages, disciplines and zones,
emerging or stabilising areas of movement.
ANALYSE
INTERPRET
OUTPUT
COMMERCIAL VISIBILITY
Clear commercial insight for confident project decisions.
-
Design movement is mapped back to commercial structures to quantify indicative cost exposure.
The platform creates a measurable connection between design progression and commercial impact.
-
QRView helps distinguish between areas with strong visibility and areas requiring further validation or stakeholder review.
Focus areas include:
emerging risk items,
validation or confidence gaps,
interpretation blind spots.
-
Interactive dashboards consolidate live project data into a single commercial view.
Registers create a structured record of movement, issues and review items.
Teams can monitor progression, exposure and emerging trends more consistently.
-
Tailored reporting outputs support technical reviews, commercial governance and executive decision-making.
Configurable reporting structures reduce reliance on manually rebuilt reporting packs.
Outputs can be aligned to different project teams, stakeholder groups and governance forums.

WHO BENEFITS
QRView supports clearer commercial visibility across every stage of project delivery.

Developers
Improve investment visibility and strengthen portfolio performance.

Government & Authorities
Strengthen governance visibility and support better project outcomes.

Contractors
Protect margins, reduce risk and deliver projects on time, on budget and on quality.

Project Teams
Collaborate with clarity and access the right information at the right time.

Explore QRView.
See how QRView brings clarity to evolving project delivery environments.